
Skip to content
Camnitive

Step 2 of 4 · Measure

Every alert becomes a number you can manage.

The same cameras that raise alerts measure the operation: how many, how long, how busy and how safe, per zone, per site and over time.

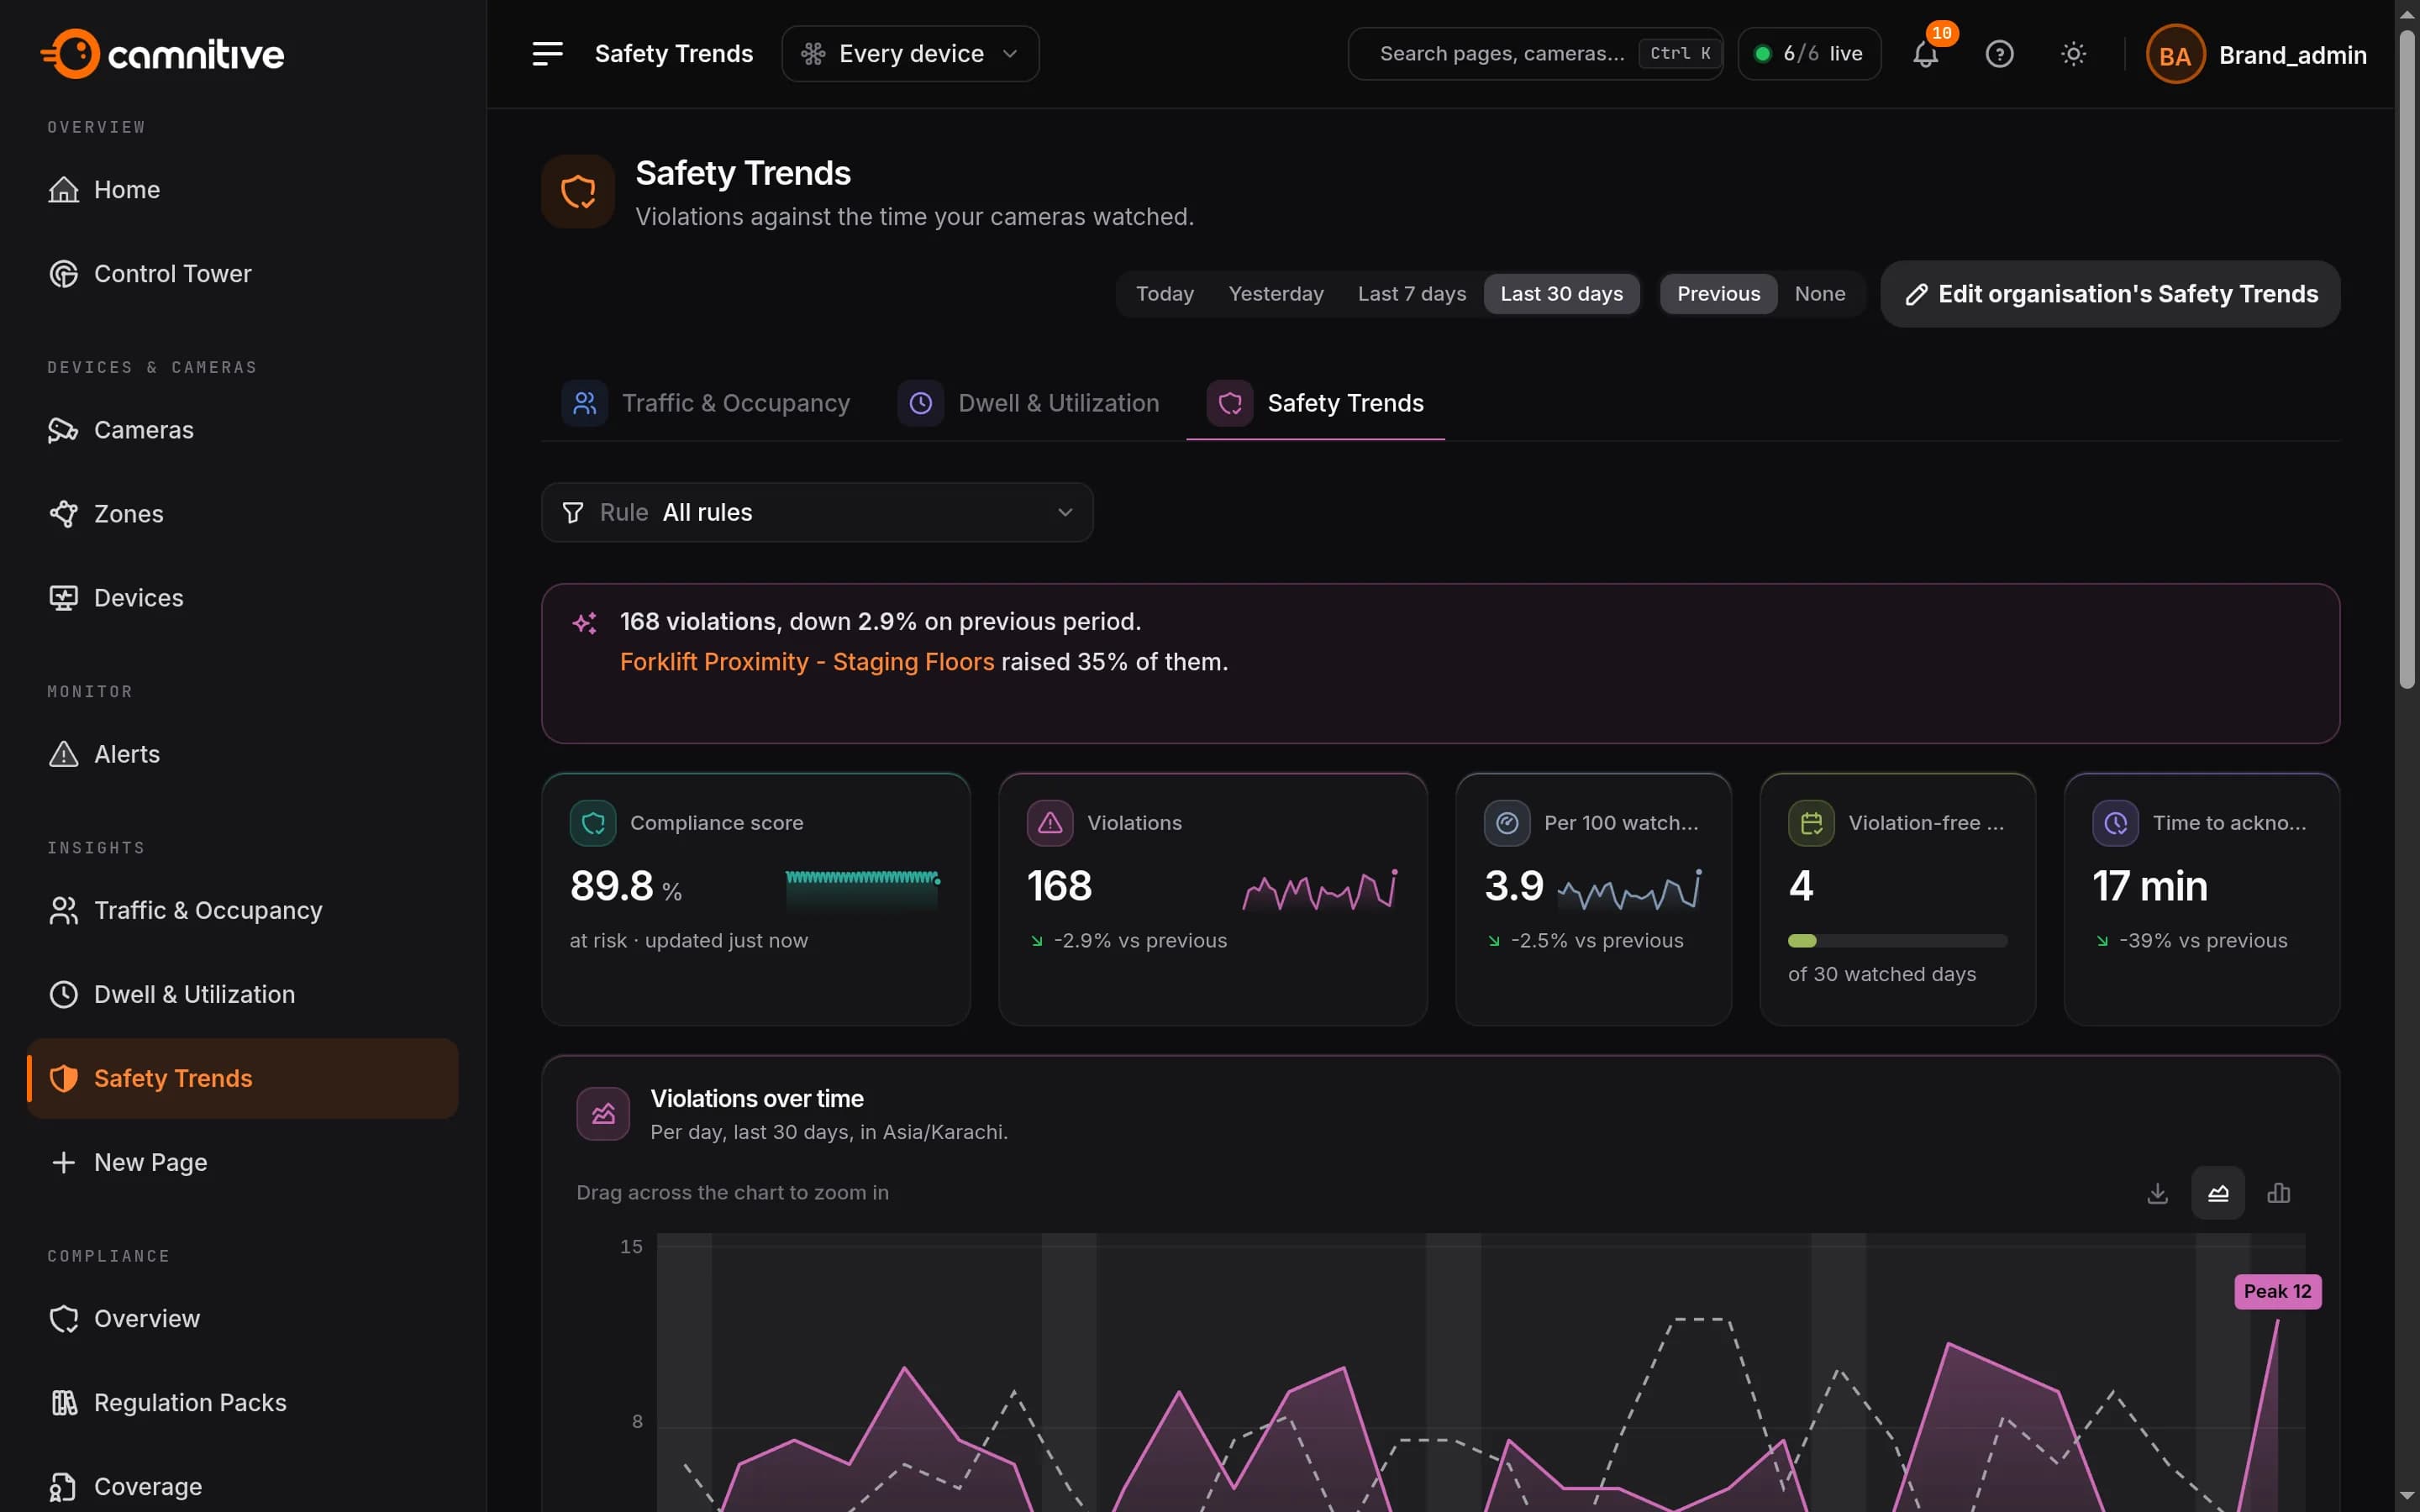
FloFusion · Safety Trends
FloFusion Safety Trends for a distribution centre: violations per 100 watched hours, time to acknowledge, and violations per day over 30 days

Measurements

Counts, occupancy, dwell, queues and time in use.

Any zone or rule can be measured: people and vehicles counted in and out, how many are in a zone, how long they stay, how long a queue is, and how much of the day a dock or a line is in use.

  • Minute by minute on the device, rolled up by hour and day in FloFusion.
  • Shifts and holidays from each site’s calendar, so a Monday morning is compared with Monday mornings.
  • Count audits: spot-check a count against the footage, so the numbers can be trusted.

Insights

Every site on one screen, compared.

Traffic and occupancy, dwell and utilisation, and safety trends, side by side for every site. Build your own Insights pages for the questions only your operation asks, and share them with your organisation.

Control Tower

The whole fleet’s health at a glance.

Which sites are live, which cameras lost their stream, which alerts wait for review, and which devices need attention, without opening each one.

Your Home

Each team pins the tiles it runs on.

Safety sees near misses and PPE, operations sees dock use and queues, leadership sees the scorecard. Each solution brings the tiles that matter for its industry.

Scorecards

A scorecard per solution, ready for the board.

Signals raised and reviewed, the compliance score and the setup still to do, per device and per site, exported as a PDF.

See it for your industry

Examples for your industry

See it on your own cameras.

A pilot on the cameras you already own, with success criteria agreed up front.

Next stepComply. The audit is every day now.Continue to comply